The Logic of Science” style=”3d” color=”black”]Presents a series of grounded science based articles covering Evolution, Global Warming, Genetic Modified Organisms (GM’s), Logic, Nature of Science, Vaccines/Alt.Medicines.[/vc_cta][/vc_column][/vc_row]
Recently, I have been frequently seeing the argument that the USA has actually done a very good job at dealing with COVID because it’s case-fatality rate (i.e., the percentage of infected individuals that die from COVID) is lower than many other countries, including many European countries like Italy, the UK, etc.
This claim actually presents a good opportunity to look at some aspects of data analysis, cherry-picking, and how stats can be abused and misused, so I want to take a very brief look at the claim and simply address the following two questions:
Are case-fatalities a good metric for how well a country responded to the outbreak?
Does the US have a particularly good case-fatality rate?
While I am focusing on those two questions because I think they are instructive, much of what I am going to describe applies to many other arguments floating around the internet regarding COVID (e.g., a faulty comparison I keep seeing of countries that did and did not use hydroxychloroquine).
So, as you read this, really try to understand the reasoning behind the answers, because that will help you analyze other claims/questions you encounter.
I want to be 100% clear at the start that this is not a political post. People often make the mistake of assuming that any discussion of any topic even remotely related to politics is inherently a political discussion. That is incorrect. Facts aren’t political.
The questions I am going to address are strictly factual, scientific questions. They can (and must) be answered with evidence and facts, not politics. Now, you can certainly use those answers to make political arguments about whom to vote for, policies that should be put in place, etc. but the answers themselves are not political. They are simple facts that are not affected by political views. They are about objective reality, not politics.
Are case-fatalities a good metric for how well a country responded to the outbreak?
How relevant case-fatalities are depends on exactly what is being claimed/discussed. If we want to look at how well countries did at treating infected patients, then case-fatalities are relevant (with a lot of caveats; see question 2), because they help to describe the outcomes for people who became infected.
However, many people (including the POTUS) keep using case-fatalities to make a more general argument about how well countries responded to the virus, and that’s a problem.
Case-fatalities are not a valid metric for how well a country contained the virus, because they only describe what happened to people who became infected. A country with 10 cases, and a country with 10,000,0000 cases could have exactly the same case-fatality rate.
Indeed, if a large country allowed its entire population to be infected, and a full 2% of the entire population died from the virus, it would still have a case-fatality rate that is better than the global average (for countries of comparable size). So, case-fatalities simply don’t show how well a country prevented outbreaks.
If we want to know how well a country did at containing the virus, we need to look at metrics like the number of cases relative to population size.
This shows the proportion of the population that became infected, and thus is the relevant metric for looking at how well the spread of the virus is controlled (there are still lots of caveats here, because things like population density have a big impact on spread). When we look at that, the US is the 10th worst country in the world.
In other words, there are only 9 countries with more cases per capita (Qatar, Bahrain, French Guiana, Panama, Aruba, Chile, San Marino, Kuwait, and Peru). Further, many of those countries have actually had very small outbreaks, but their populations are so small that it’s a large per-capita rate.
At the time of writing this, San Mario only had 735 cases, Aruba only had 2,358, and French Guiana 9,276; so those aren’t really fair comparisons. Regardless of whether you want to include those three, however, the point stands that the US has done one of the worst jobs of any country in the world at containing the virus and has done worse than the European countries people keep comparing to.
That’s not a political statement, that is a simple, empirical fact (again, there are caveats that make it hard to actually precisely rank countries, but it is very clear from the data that the US is on the bad end of the distribution).
Does the US have a particularly good case-fatality rate?
Let’s now turn our attention to the question of whether or not the US has a good case-fatality rate, and this is going to bring in several important points about data analysis.
First, for all of the comparisons I’m going to talk about, I’ve limited the data to countries that have had at least 10,000 cases of COVID19 (I decided to do that before I ran any analyses).
The reason for this is that percentages can be very unreliable when dealing with small sample sizes. As a result, including countries with few infections generates a lot of what we call “noise” in the data and it makes it hard to see the patterns that are really there, because those patterns are obscured by chance variation in small sample sizes.
Also, only using countries that had fairly large outbreaks allows us to compare apples to apples and reduce some of the confounding facts (more on that in a minute).
So, when we do that, how well has the US done? There’s actually a lot of variation in these data, ranging from Singapore with a case-fatality rate <0.1% to Italy with a 13% fatality rate.
The mean value is 3.1%, but because of a few extremes like Italy, you could make the case that the median is more appropriate, and it is 2.4%.
So, how does the US compare? Its case-fatality rate is 3.0%, which is extremely average.
It’s ever so slightly better than the mean value, and slightly worse than the median value, but either way it’s pretty close to the average. Not terrible, but also not great.
At this point, you may be thinking, “fine, the US did not do a good job of containing the virus, and it has done an average job of treating cases, but it still did better than most European countries,” but there is more going on here than is revealed by the crude percentages.
We also have to consider confounding factors. There are things other than the variable we are interested in that vary among the groups we are comparing (countries in this case).
It is obviously true that there are many differences among these countries other than simply how they treated COVID-19 patients.
To give one obvious example, as I perused these data and looked at the lists of European countries that people kept saying the US did better than, I realized those most of those countries have older populations than the US does.
We know that there is a strong relationship between death from COVID and age, with the elderly being far more likely to die following an infection. So, we’d naturally expect countries with older populations to have more deaths per case load (i.e., population age is a confounding factor).
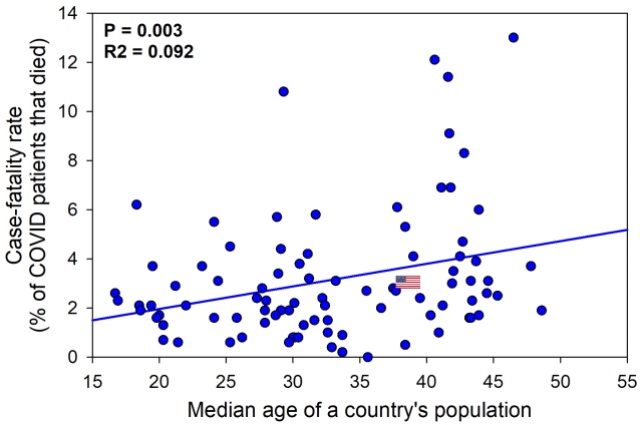
Correlation between median population age of a country and its case-fatality rate.
To actually examine this, I ran a regression between median age of the population in each country and the case-fatality rate.
Unsurprisingly, there is a statistically significantpositive relationship (P = 0.003). In other words, just as we’d, expect countries with older populations have higher case-fatality rates on average, and, as I said, the European countries that have higher case-fatality rates than the US tend to have older populations.
In other words, population age is at least part of the reason why the US has a lower case-fatality rate than many European countries.
Now you may be wondering how much of a role population age is playing, so to get at least a crude answer to that, let’s dig a bit deeper into the scatter plot. The closer points are to the line, the more they conform to the central tendency of the data (by definition).
In other words, when points are right on the line, then the general relationship between the X and Y variables is doing a good job of explaining those points. When points are further from the line, then other factors are at play and are explaining some of the variation in the data (the vertical distance between a point and the line is called the “residual” and is the variation that is not explained by the relationship between X and Y).
For the total data set here, the R2 value (a correlation coefficient) is 0.092, which indicates that 9.2% of the variation in the entire data set is explained by the relationship between age and case-fatalities.
Some countries, (like the US) are very close to the line, whereas others (like Italy) are much further.
In other words, we know that median population age is explaining some of the variation in the data, and the US is close to where we’d expect it to be, based on that factor. So, age does a good job of explaining why the US is where it is on this graph.
To flip what I mean by that, we can us the equation of this line to predict a country’s case fatality rate based on its population age.
The equation of this line is y = 0.0009x + 0.0012 and the median age for the US is 38.5 (x).
So, the predicted case-fatality rate based entirely on population age is 3.6%. Its actual case-fatality rate is 3.0%. Thus, the actual case-fatality is lower than expected (based on this single factor; there are others) but not by a huge amount, and overall, population age does a fairly good job of predicting where America falls.
What about the rest of the variation?
Well, there are lots of other confounding factors. Things like high population density (which results in very rapid, very localized outbreaks that overwhelm health-care systems) can have a huge impact. Further, some of the variation will inevitably be due to chance.
So, when we add all of that up, how has the US done at actually preventing deaths once people become infected?
It’s hard to precisely rank it without doing a full, in depth statistical analysis that takes all confounding factors into account, but based on the available data, it’s done ok at treating patients once they become infected, but not exceptional.
It has had an average response, and we know that a lot of the variation in the data is explained by confounding factors like age (also, again, that is just for treating people once they became infected; preventing infections is another story).
Conclusion
In short, you cannot use case-fatality rates to argue that a country did well or poorly at containing the virus and preventing its spread, because that metric shows what happened when people became infected, rather than reflecting the proportion of the country that became infected.
It is possible for 100% of a population to be infected with COVID and still have a good case-fatality rate.
Further, the USA has an average case-fatality rate. It’s not great, but it’s not terrible either. However, these comparisons are inherently problematic because there are many confounding factors.
Things like the median age of a population have an effect, and many of the countries that have worse case-fatality rates than the USA also have older populations than the USA. We need really rigorous statistical analysis that measure and account for all of the confounding factors to get a clearer picture of why case fatalities are high in some countries and low in others.
Finally, I want to stress again that none of this is political. These are simple facts. You can certainly use those facts to make political arguments, but the facts themselves are not political. They are objective statements of reality.
Note: Although case-fatalities are not a good metric of how well a virus was contained, they can be influenced by the course a virus took in the country. A very large, localized outbreak that overwhelms the healthcare system will have a higher case-fatality rate than an outbreak that is very spread out (this is why there was so much focus on flattening the curve).
However, it is still not a good metric because of all the reasons I’ve listed, and because there are many scenarios in which it is influenced by the outbreak course, but not in a way that is reflective of how well the outbreak was contained.
Consider, for example, one country that had a single, localized outbreak that was contained and didn’t spread beyond that area, but did overwhelmed the resources in that area, and compare that to another country that never had that sort of extreme local outbreak, but failed to contain the virus and let it infect most of the country.
The former clearly did better at containing the virus and will have far fewer cases and deaths per capita but will also likely have a higher case-fatality rate.
Update: As several people mentioned on social media, it is also worth pointing out that case-fatality rates are sensitive to the level of testing employed.
When little testing is done, it often results in a high case-fatality rate because many people with COVID aren’t included. So for case-fatalities to be accurate, you need broad testing.
Additionally, making comparisons can be complicated by differences in testing procedures and standards.
Data sources
The data on infections per capita were obtained from WorldOMeter on 05-Sep-2020
Data on population ages were obtained from citypopulation.de on 04-Sep-2020
Date on case-fatalities were obtained from Johns Hopkins on 04-Sep-2020 (both worldometer and Johns Hopkins have case-fatality data which are in close agreement with each other, but I considered Johns Hopkins to be more reputable and therefore used their data)
This article was written by a professional scientist who writes under the name – “Fallacy Man“
The article has been reproduced by kind permission of the publication – “The Logic of Science”

Recently, I have been frequently seeing the argument that the USA has actually done a very good job at dealing with COVID because it’s case-fatality rate (i.e., the percentage of infected individuals that die from COVID) is lower than many other countries, including many European countries like Italy, the UK, etc.
Case-fatalities are not a valid metric for how well a country contained the virus, because they only describe what happened to people who became infected. A country with 10 cases, and a country with 10,000,0000 cases could have exactly the same case-fatality rate.

 Policy")

